Categorical variable
Categorical variables contain a finite number of categories or distinct groups. Categorical data might not have a logical order. For example, categorical predictors include gender, material type, and payment method.
Quantitative variables can be classified as discrete or continuous.
Quantitative data is data expressing a certain quantity, amount or range. Usually, there are measurement units associated with the data.
Discrete variable
Discrete variables are numeric variables that have a countable number of values between any two values. A discrete variable is always numeric. For example, the number of customer complaints or the number of flaws or defects.
- Bar graph: A diagram in which the numerical values of variables are represented by the height or length of lines or rectangles of equal width

Continuous variable
Continuous variables are numeric variables that have an infinite number of values between any two values. A continuous variable can be numeric or date/time. For example, the length of a part or the date and time a payment is received, or the blood type of a person: A, B, AB or O.
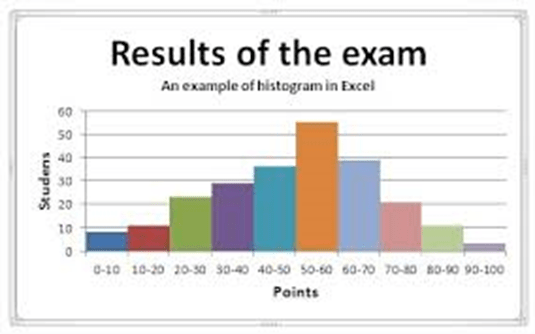
- Histogram: A diagram consisting of rectangles whose area is proportional to the frequency of a variable and whose width is equal to the class interval.
| BASIS FOR COMPARISON | DISCRETE DATA | CONTINUOUS DATA |
| Meaning | Discrete data is one that has clear spaces between values. | Continuous data is one that falls on a continuous sequence. |
| Nature | Countable | Measurable |
| Values | It can take only distinct or separate values. | It can take any value in some interval. |
| Graphical Representation | Bar Graph | Histogram |
| Tabulation is known as | Ungrouped frequency distribution. | Grouped frequency distribution. |
| Classification | Mutually Inclusive | Mutually Exclusive |
| Function graph | Shows isolated points | Shows connected points |
| Example | Days of the week | Market price of a product |
